Why tracing an LLM app is different
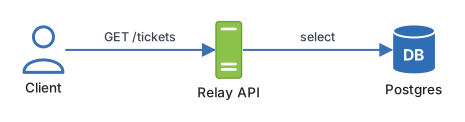
When an ordinary backend misbehaves, the trace is usually enough. You open the request, see that a database query took four hundred milliseconds instead of four, and you know what to fix. The code is deterministic: the same input takes the same path, and the path is the story.
An LLM app breaks that assumption in four ways at once. The interesting input is not a handful of query parameters but a few thousand tokens of assembled prompt, and the interesting output is prose. The same input can produce a different output tomorrow. Every call has a price attached, and the price varies with the length of the conversation. And "it worked" is no longer a status code: a two-hundred response can carry a confidently wrong answer. Tracing an LLM app means capturing all of that, per call, and being able to find the bad ones afterwards.
What a request trace already gives you
The vocabulary from distributed tracing still applies, and Langfuse is built on it; the v3 Python SDK is OpenTelemetry underneath. A trace is one unit of work, usually one request to Relay's /chat. It contains a tree of spans: search the help articles, call the model, run a tool, call the model again. Each span has a start time, an end time, a name, and whatever attributes you attach.
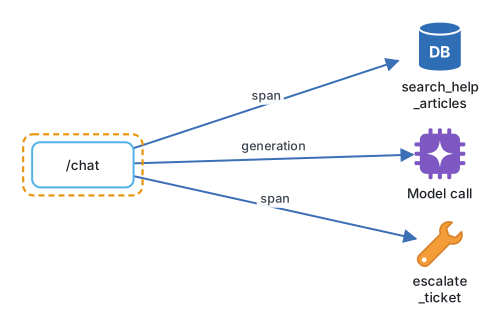
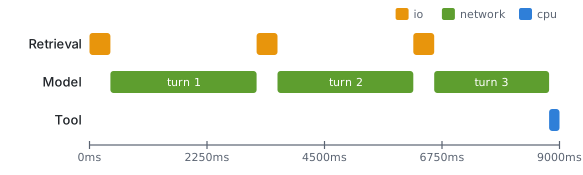
That gets you latency and structure. For Relay it answers questions like "why did this reply take nine seconds" (the agent called search_help_articles three times) or "which route is slow". Those are real questions, and you should keep asking them.
What an LLM trace has to add
Four things, and each one is a reason plain logs are not enough.
| Need | Why a log line is not enough | What the trace stores |
|---|---|---|
| The exact prompt and completion | Prompts are assembled from templates, history, and retrieved text; the final string exists only in memory | Full input and output on a generation span |
| Tokens and cost | Price depends on input length, output length, and model; you cannot derive it from timings | Prompt tokens, completion tokens, model name, computed cost |
| The loop | An agent is a sequence of decisions; the failure is often step three of five | Nested spans for each model call and each tool call |
| Quality | Nothing in the response says it was wrong | Scores attached later by a person, a rule, or a judge model |
The first row matters more than it looks. When a customer says Relay told them the wrong refund window, the question is not "what did the code do" but "what did the model see". If the retrieved help article was out of date, the prompt is the evidence. Without it you are guessing.
Here is what a single generation looks like once it is recorded. The shape is the point, not the exact field names.
{
  "name": "answer",
  "type": "generation",
  "model": "gpt-6-astra",
  "input": [
    {"role": "system", "content": "You are Relay, a support assistant..."},
    {"role": "user", "content": "Where is my refund?"}
  ],
  "output": "Refunds are issued within five working days of approval...",
  "usage": {"input": 1840, "output": 96},
  "cost_usd": 0.0041,
  "latency_ms": 1320,
  "parent": "chat-request-7f3a"
}
Compare that with the logging most projects start with.
import logging
import time

log = logging.getLogger("relay")


async def answer(question: str) -> str:
    started = time.perf_counter()
    reply = await call_model(question)
    elapsed_ms = (time.perf_counter() - started) * 1000
    log.info("answered in %.0f ms", elapsed_ms)
    return reply
This records that something happened and how long it took. It does not record the prompt, the tokens, or which tool calls ran first, and it cannot be joined to the thumbs-down the customer sends four minutes later. Each of those gaps becomes a support ticket you cannot investigate.
The three questions a good trace answers
It helps to design tracing backwards from the questions you will ask at two in the morning.
- What happened in this one request? The tree: which tools ran, in what order, with what arguments, and what the model produced at each step.
- What is happening across many requests? Cost per day, cost per customer, latency per model, the share of conversations that ended in an escalation.
- Which requests were bad, and why? Scores from user feedback and automated judges, filterable, so you can open the worst twenty and read them.
Question one is what @observe and the OpenAI drop-in give you almost for free. Question two needs a user and a session on every trace. Question three needs scores. The next four lessons add exactly those pieces to Relay, in that order.
Engineering note. Decide what you are allowed to store before you store it. Prompts contain customer names, email addresses, and sometimes card numbers, so a tracing tool is a database of everything your users said. Redact before you send, and treat access to traces like access to production data.
Where it goes wrong
- Tracing only the model call. A generation with no parent tells you what the model said but not why it was asked. Trace the whole request so the retrieval and tool spans sit around it.
- Sampling too early. One percent sampling is sensible for a high-volume API. For an agent handling a few thousand conversations a day it hides the exact failure you are looking for. Trace everything until volume forces the question.
- Treating latency as the health signal. A model that answers fast and wrong looks healthy on a latency dashboard. Until scores exist, you have no quality signal at all.
- Printing the prompt to stdout instead. It lands in a log aggregator with no structure, no cost, no link to the response, and a retention policy nobody chose with personal data in mind.
Try it
Take one Relay /chat request and write down, by hand, the tree you would want to see for it: the request span, the search_help_articles call, the model generation, and the escalate_ticket call if it happened. For each node, list the three attributes you would need to debug a wrong answer. Keep the sheet; over the next lessons you will check that the real trace contains every item on it.
Next, Langfuse setup and the OpenAI drop-in puts the first real generation on that tree with a one-line change.
Continue with the complete track
Keep your progress and unlock the surrounding lessons, exercises, and complete learning path.
Unlock the complete track