Measuring TTFT, TPS, and percentiles
Every latency budget from the previous lesson was built on assumed numbers. This lesson replaces them with measured ones. The method is plain: record a timestamp when a request leaves, record another each time a piece of the streamed answer arrives, and compute everything else from that list. Then repeat it hundreds of times and describe the results with percentiles, because the average of a latency distribution hides exactly the requests people complain about.
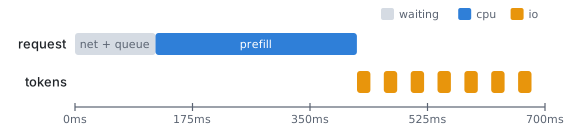
Measure at the client whenever you can. The engine's own metrics start when the engine receives a request, so they cannot see a slow gateway, a cold connection, or a distant region. The client sees everything the user sees.

Five numbers from one list of timestamps
| Metric | Definition | Driven by |
|---|---|---|
| TTFT | First token arrival − request sent | Network, queue, prefill |
| ITL | Gap between consecutive tokens | Decode |
| TPOT | (End-to-end − TTFT) ÷ (output tokens − 1) | Decode, averaged over one request |
| End-to-end | Last token arrival − request sent | All of the above |
| Per-user TPS | 1,000 ÷ ITL (or TPOT) in ms | Decode |
Inter-token latency (ITL) is the list of individual gaps, which you can take percentiles of. Time per output token (TPOT) collapses one request's gaps into a single average. Tokens per second means two different things: per-user TPS is how fast one stream arrives, and total or system TPS is the sum across all concurrent streams, which is throughput.
Work one Kite chat request through. It returns 400 tokens, the first arriving at 420 ms and the last at 8,400 ms.
- TPOT = (8,400 − 420) ÷ (400 − 1) = 7,980 ÷ 399 = 20 ms
- Per-user TPS = 1,000 ÷ 20 = 50 tokens per second
- If 32 such streams run concurrently at that speed, system TPS = 32 × 50 = 1,600 tokens per second
The last line comes with a warning: ITL at 32 concurrent streams is rarely the ITL you measured with one. Larger batches raise total throughput and slow each user down, so always state the concurrency next to the number.
Timing a streamed request
This function uses the OpenAI Python SDK against any OpenAI-compatible server, such as vLLM on port 8000. It records one timestamp per content chunk.
import time
from openai import OpenAI

client = OpenAI(base_url="http://localhost:8000/v1", api_key="unused")
MODEL = "Qwen/Qwen3-30B-A3B-Instruct-2507"

def timed_request(prompt: str, max_tokens: int = 200) -> dict:
    start = time.perf_counter()
    arrivals = []
    stream = client.chat.completions.create(
        model=MODEL,
        messages=[{"role": "user", "content": prompt}],
        max_tokens=max_tokens,
        stream=True,
    )
    for chunk in stream:
        if chunk.choices and chunk.choices[0].delta.content:
            arrivals.append(time.perf_counter())
    gaps = [b - a for a, b in zip(arrivals, arrivals[1:])]
    return {
        "ttft_ms": (arrivals[0] - start) * 1000,
        "e2e_ms": (arrivals[-1] - start) * 1000,
        "itl_ms": [g * 1000 for g in gaps],
        "chunks": len(arrivals),
    }
The client is created once, outside the function, so its connection is reused and a TLS handshake does not land inside the first measurement of every call. time.perf_counter() is a monotonic clock meant for intervals; wall-clock time can jump.
Percentiles, not means
Suppose you time 100 requests: 97 have a TTFT of 300 ms and 3 hit a queue spike and take 6,000 ms.
- Mean = (97 × 300 + 3 × 6,000) ÷ 100 = (29,100 + 18,000) ÷ 100 = 471 ms
- P50 = the 50th value in sorted order = 300 ms
- P90 = the 90th value = 300 ms
- P99 = the 99th value = 6,000 ms
The mean, 471 ms, describes no request that actually happened. The median says most users are fine. P99 says three in a hundred wait six seconds, and at 200,000 requests a day that is 6,000 bad experiences. Report all three percentiles and let the mean go.
import math

def percentile(values: list[float], p: float) -> float:
    ordered = sorted(values)
    rank = math.ceil(p / 100 * len(ordered))  # nearest-rank method
    return ordered[max(rank, 1) - 1]

def report(name: str, values: list[float]) -> None:
    cells = "  ".join(f"P{p}={percentile(values, p):7.1f}" for p in (50, 90, 99))
    print(f"{name:>8}  {cells}")

results = [timed_request(f"Case {i}: explain Python decorators.") for i in range(300)]
report("ttft_ms", [r["ttft_ms"] for r in results])
report("itl_ms", [g for r in results for g in r["itl_ms"]])
report("e2e_ms", [r["e2e_ms"] for r in results])
tpot = [
    (r["e2e_ms"] - r["ttft_ms"]) / (r["chunks"] - 1)
    for r in results if r["chunks"] > 1
]
report("tpot_ms", tpot)
print(f"per-user TPS at median TPOT: {1000 / percentile(tpot, 50):.1f}")
Each prompt begins with a different case number, so no request can reuse another's cached prefix. That measures cold prefill on purpose; real Kite traffic shares a system prompt and would see lower TTFT.
This loop sends one request at a time, which measures the best case. To measure under load, use a benchmark that sends requests at a fixed rate whether or not earlier ones have finished:
vllm bench serve --model Qwen/Qwen3-30B-A3B-Instruct-2507 \
  --dataset-name random --random-input-len 2000 --random-output-len 200 \
  --num-prompts 500 --request-rate 8 \
  --percentile-metrics ttft,tpot,itl,e2el --metric-percentiles 50,90,99
Engineering note. A P99 computed from 100 requests is decided by a single request, so it changes every time you rerun. Collect at least a thousand samples before trusting a P99, and always write the request rate or concurrency beside it.
Where it goes wrong
- Chunks are not always tokens. A server may pack several tokens into one streamed chunk, especially with speculative decoding. Chunk gaps then overstate ITL and chunk counts understate output tokens.
- No warm-up. The first requests after a server starts can include compilation and cache warm-up. Discard them.
- A client that becomes the bottleneck. A single Python process parsing hundreds of streams can fall behind, and you end up measuring the client.
- Averaging percentiles. The P99 of a fleet is not the average of each replica's P99. Merge the raw samples, or histograms, and compute it again.
- A closed-loop benchmark. A client that waits for each response before sending the next slows its own arrival rate when the server slows, hiding the queue that real users would build.
Try it
Start any small model behind an OpenAI-compatible server, on a rented GPU with vLLM or a laptop-sized model locally. Set MODEL to its name, run the script with 300 requests, and record P50, P90, and P99 for TTFT and TPOT. Then run vllm bench serve at request rates of 2, 8, and 16 and plot P90 TTFT against rate. Find the rate at which TTFT stops being flat and starts to climb; that knee is roughly where this server's capacity ends.
Next, picking the smallest model that passes turns these measurements toward a different question: which model to serve in the first place.
Continue with the complete track
Keep your progress and unlock the surrounding lessons, exercises, and complete learning path.
Unlock the complete track